Ned Thomas, Yorke Peninsula Country Times
Scientists and government authorities are at odds over what a noticeable shift in desalination monitoring data is really showing.
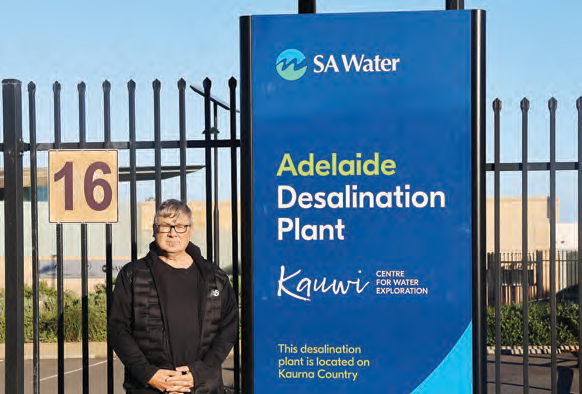
Photo: Yorke Peninsula Country Times.
The Adelaide Desalination Plant at Lonsdale has come under renewed scrutiny following months of debate about the cause of the harmful algal bloom which has affected South Australian waters.
Public attention intensified after a heated exchange between Yorke Peninsula residents and Department for Environment and Water representatives at an algal bloom forum in Moonta in April.
Some community members have alleged the desalination plant, which discharges highly concentrated brine into Gulf St Vincent, contributed to triggering the bloom, which has spread across SA waters since March 2025.
However, the state government and environmental agencies maintain there is no evidence linking the plant to the outbreak.
The line that moved
The Adelaide Desalination Plant is one of the most heavily monitored pieces of infrastructure in South Australia.
According to both SA Water and the Environment Protection Authority, the facility has remained compliant with its environmental licence throughout its operation.
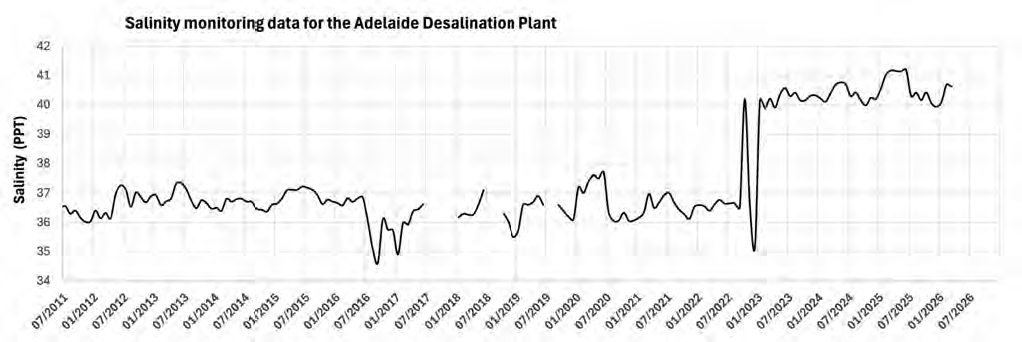
From 2011 until late 2022, salinity readings near the plant’s discharge zone remained relatively stable. Then the line jumps.
By early 2023, reported salinity values had shifted upwards by almost four parts per thousand and have largely remained there ever since.
EPA acknowledges change of method
Following discussions with Dr Kaempf, the EPA confirmed the method used to convert conductivity measurements into salinity values changed during late 2022.
It has since advised historical reporting will be reverted to the previous calculation method, to maintain consistency across the long-term dataset.
However, Dr Kaempf argues the explanation does not fully resolve the issue.
“Salinity values greater than 40 parts per thousand at the discharge are incorrect and inconsistent with previous calibrated measurements,” he said.
For Dr Kaempf, the abrupt nature of the change raises questions.
“Such jumps do not occur in nature,” he said.
“There is only one true and correct salinity that should be reported.”
In a separate interview discussing South Australia’s harmful algal bloom, Dr Kaempf noted salinity levels above 40 parts per thousand were typically associated with naturally hypersaline waters in the upper Spencer Gulf, not off Adelaide’s coast.
Why the numbers matter
Dr Kaempf said the issue was not simply about a graph.
He argued salinity monitoring sat at the heart of the plant’s environmental licence and therefore must be accurate.
“If you observe a discrepancy between your salinities and the true salinities, then that needs to be investigated,” he said.
Dr Kaempf said salinity monitoring existed because highly concentrated desalination brine could pose risks to marine ecosystems if it was not adequately diluted.
“Without dilution there is the risk that the desal brine creeps along the seafloor and forms what we call a brine underflow,” he said.
“That kills off any marine life coming into contact with it.”
He said particular attention should be paid during dodge tides, a South Australian term used to describe periods of exceptionally weak tidal movement.
According to the Bureau of Meteorology, dodge tides are associated with very weak neap tides and minimal rise and fall in sea level over one or two days.
Dr Kaempf said weaker water movement during these periods could reduce natural mixing around discharge areas if diffuser systems were not performing as intended.
Compliance not in dispute
While the interpretation of the data remains contested, both SA Water and the EPA are unequivocal on one point: the Adelaide Desalination Plant remains compliant with its environmental licence.
SA Water says ambient salinity levels are monitored every 10 minutes using conductivity probes and that the plant has never exceeded the requirement to remain within 1.3 parts per thousand of background conditions at the edge of the mixing zone.
“To date, the plant has never exceeded this limit,” an SA Water spokesperson said.
The EPA has reached the same conclusion.
“The ADP has continued to remain compliant with its licence, with the salinity difference between the intake monitoring point and discharge monitoring point remaining less than 1.3 parts per thousand,” an EPA spokesperson said.
The spokesperson said salinity in the marine environment was typically about 35 parts per thousand and noted it routinely monitored salinity throughout South Australia’s coastal waters through its Aquatic Ecosystem Condition Reporting program.
More than a compliance debate
SA Water has also stressed the monitoring network was never intended to track long-term environmental trends across Gulf St Vincent.
That distinction may sit at the heart of the debate.
For regulators, the monitoring system exists to ensure the desalination plant remains within licence limits.
For Dr Kaempf, the same dataset may also provide insights into problems within the monitoring record itself.
One interpretation sees a compliance tool functioning exactly as intended.
The other sees an unresolved anomaly hidden within a decade of publicly reported data.
Whether the apparent jump reflects a calculation issue, a monitoring anomaly, broader environmental change or some combination of factors remains unresolved.
What is beyond dispute is the graph.
For more than a decade, the line remained largely flat.
Then it spiked upwards.
Dr Kaempf and authorities still disagree on why.
What the graph shows
Plant’s brine discharge point into Gulf St Vincent.
Image courtesy Yorke Peninsula Country Times.
The accompanying graph tracks reported salinity levels near the Adelaide Desalination Plant’s brine discharge using publicly available Environment Protection Authority monitoring data compiled by marine scientist Dr Jochen Kaempf.
For most of the record, which spans 2011 to 2025, reported salinity levels fluctuate within a relatively narrow band between about 36 and 37 parts per thousand.
Around late 2022 and early 2023, the pattern changes. Instead of continuing within the previous range, the reported values shift upwards and remain at a higher level.
Since then, salinity readings have generally been reported at around 40 parts per thousand.
The graph does not explain why the change occurred. It simply shows that the long-term pattern before 2023 differs markedly from the pattern recorded afterwards.
Whether the shift reflects a change in calculations, monitoring or another factor is the subject of ongoing debate.
This article appeared in Yorke Peninsula Country Times, 23 June 2026.
