
As a critic of the climate catastrophists—and someone who prefers a long-term, science-based view of climate change—I thought I’d share a basic understanding of the science and terminology behind the Bureau of Meteorology forecasts we rely on.
Now, the amateur weather forecasters already fluent in the jargon can skip this. But those who keep clicking the weather app without knowing what drives the fronts that bring our opening and closing rains probably shouldn’t.
Every time a farmer glances at the Bureau’s forecast, the same terms pop up: Indian Ocean Dipole, El Niño–Southern Oscillation, Southern Annular Mode, cold fronts from the Great Southern, tropical moisture feeds, and the Leeuwin Current. Most of us nod as if we understand—but do we really grasp how these moving parts interact to bring the break, or deny it?
This guide unpacks the jargon and grounds it in real-world terms. Next time you stare at a satellite map or seasonal outlook, you’ll see more than squiggly arrows and acronyms—you’ll see the story behind the symbols.
Picture the Earth as a ball floating in a fish tank, heated at the equator by a giant lamp. The heat warms the water, which rises and circulates. Add the Earth’s spin and you get wind patterns and ocean currents—most importantly for us, the Leeuwin Current.
This warm ocean flow, forced through the Papua and Indo gap, travels down WA’s coastline like a marine conveyor belt of heat and moisture. It’s why we don’t live in a cold, foggy wasteland like coastal Chile or Namibia. The Leeuwin lifts our coastal sea surface temperatures by several degrees, fuelling cloud formation and moderating our autumn and early winter weather. In strong years, it powers past Albany; in weak ones, it barely nudges Geraldton.
Forecasting tip: warm water means more atmospheric moisture. If ocean temperatures off the northwest coast are dropping fast in April, that’s your early clue about May rainfall. The rock lobster fishers already know this—warm water equals strong Leeuwin flow.
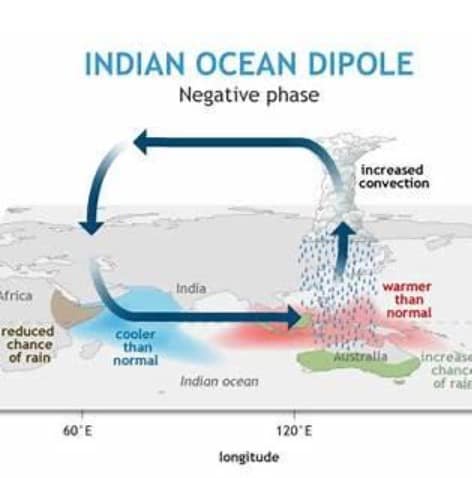
Then there’s the Indian Ocean Dipole (IOD), often called the Indian Ocean’s version of El Niño. When the IOD is negative, warm water pools near Indonesia, pushing moisture toward Australia and boosting winter rain. When it’s positive, that warmth shifts west toward Africa, shutting off the moisture tap. A neutral IOD? Anyone’s guess.
Next, the Southern Annular Mode (SAM). SAM measures how far north or south the westerly wind belt around Antarctica sits. A negative SAM shifts the belt northward, pushing cold fronts into southern WA—a good thing. A positive SAM pushes the westerlies away, leaving high-pressure systems parked stubbornly over the Bight. That’s when we get blue skies and dry paddocks.
Add the El Niño–Southern Oscillation (ENSO) and you’ve got the big three global drivers. But they rarely work alone. A negative IOD plus a negative SAM can bring the goods; throw in a La Niña and you might get an early break. Reverse those signs—positive IOD, positive SAM, and El Niño—and you’re probably staring at a decile 1.
To play along at home, bookmark the NOAA and BOM sea surface temperature (SST) anomaly maps. Learn to read the rainbow bands and spot the hot blobs—off Indonesia, west of Broome, and south of Madagascar. They’re moisture signals. Sub-surface temperature maps show warm patches 100 metres below the surface—“heat blobs” that can rise and feed rainfall weeks later.
Add the Agulhas Current—the Leeuwin’s cousin—running down Africa’s east coast. When it loops back into the Indian Ocean, it can send warm eddies drifting toward our quadrant. Those eddies can lift basin temperatures by a few tenths of a degree. And a few tenths matter.
Ocean temperature gradients also count. A warm patch off Exmouth and a cold patch off Albany can create atmospheric instability. The sharper the contrast, the higher the likelihood of a rainband as a front approaches. Uniform temperatures? Not so helpful. It’s the contrasts that spark convection.
Locally, WA farmers need to watch what’s happening in their own backyard. Micro-influences—topography, soil type, ground cover, even stubble management—can determine whether a paddock gets 5 mm or 15 mm from the same cloud. A cold hollow might trap fog but block lift; a sandy ridge might heat up and trigger a passing shower. These local effects rarely appear in the big models, but they matter—sometimes more than the IOD or SAM.
Final tip: timing matters. A cold front hitting dry air or soil often fizzles. But if the soil’s been primed by earlier showers—or if tropical moisture lingers—you’ve got the setup for real rain. That’s why two years with similar forecasts can deliver vastly different outcomes.
Weather forecasting—especially in WA—is part science, part art, and part gut feel. The science gives us the tools: satellite feeds, SST maps, supercomputer models, and climate indices. The art comes from interpretation. The gut feel comes from decades staring at the sky and the paddock.
So next time someone throws around acronyms like ENSO, SAM, or IOD at the pub, you’ll be ready to nod with confidence. You may not have a PhD in atmospheric physics—but if you understand the heat lamp, the spinning ball, the Leeuwin Current, and the warm blob off Broome, you’re already halfway to being an amateur meteorologist.
And if you get it wrong? Just blame SAM.
