
Agri-fintech company DAS (Digital Agriculture Services) has developed a Rural Sales Dashboard, an interactive tool for interrogating the data behind rural property sales across Australia’s mainland states and the NT.
DAS has published its Australian Rural Property Sales Report 2025 and now has released its first quarterly report using findings from the dashboard, Rural Property Sales Report Q1 2026.
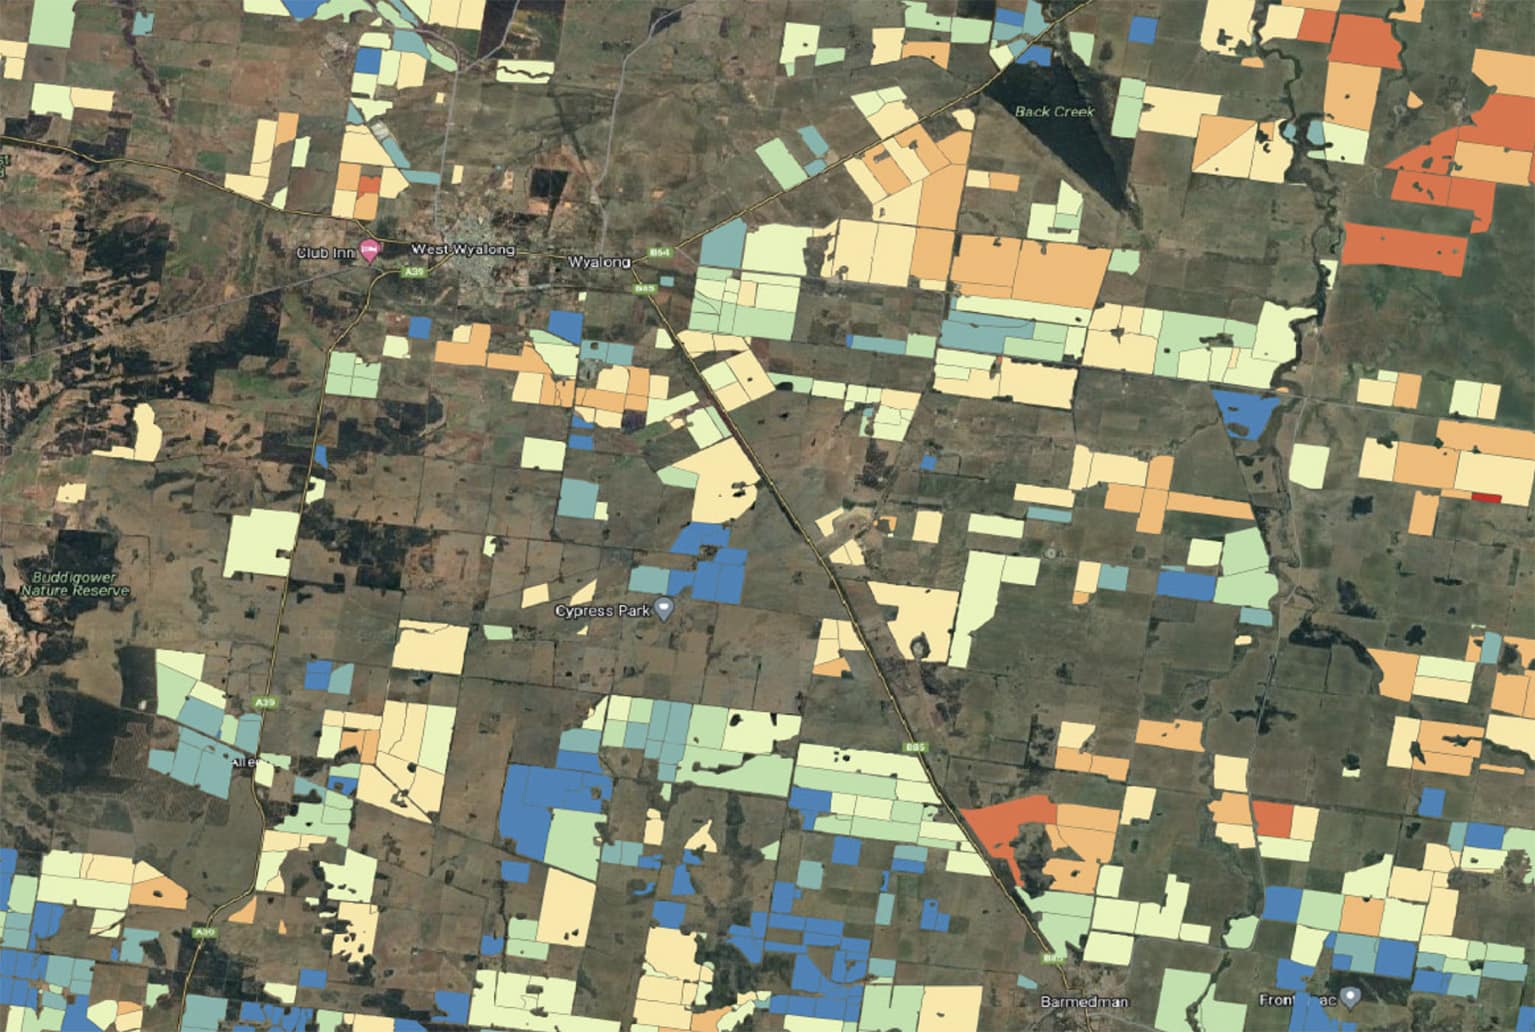
The DAS Dashboard integrates property level rural sales data with enriched spatial and geospatial datasets. It is a valuable tool for analysing the rural property market at local and regional level and by industry sector.
Its property level insights include land area and land use classification, rainfall history, sale history, slope and elevation and climate risk indicators.
The DAS Dashboard may be able to be of assistance also to researchers exploring the impact of critical policy and policy changes at state and federal level that affect the viability of particular regions and sectors (such as the ban on live sheep exports and closure of the native forestry industry in some states, water buybacks and the operation of the Murray-Darling Basin Plan), changes in planning laws and zoning, energy infrastructure built or proposed, road and rail infrastructure, communications infrastructure, the location of national parks and the standard of management of them including with regard to feral animals and weeds, other biosecurity issues, mining operations built, closing or proposed, and even relative cost of supply inputs.
Find out more about the DAS Rural Property Dashboard here.
National farmland values ease in Q1 2026 according to DAS Rural Property Data
DAS (Digital Agriculture Services), Media Release, 26 May 2026
New DAS data reveals changing market conditions across Australia’s rural property sector
National rural property values softened in the first quarter of 2026, reflecting a period of market recalibration following several years of strong growth across many agricultural regions.
New data from DAS (Digital Agriculture Services) shows the national median price per hectare declined by 7.4 per cent during the quarter, highlighting the increasingly dynamic nature of Australia’s farmland market and reinforcing the need for timely, reliable property intelligence.
The findings are drawn from the DAS Australian Rural Property Sales Dashboard, which analyses settled rural property transactions across Australia and provides near real-time visibility into market activity, pricing trends and regional performance.
Despite the national decline, market conditions varied significantly between regions, with some agricultural areas continuing to record strong price growth while others experienced softer conditions. The results point to a more selective market, where local factors, production potential, infrastructure access and long-term investment confidence are playing an increasingly important role in determining value.
Sarah Gorman, Co-founder of DAS, said the latest results demonstrate the importance of understanding rural property markets at a regional level rather than relying on broad national averages.
“Australian farmland remains one of the country’s most important asset classes, but we’re seeing greater variation in performance between regions,” she said.

“Buyers, lenders and investors need access to timely market intelligence to understand where value is being created, where demand is strengthening and how conditions are evolving across different agricultural sectors.”
Gorman said the growing availability of high-quality data is changing how rural property decisions are made.
“Historically, rural property analysis relied heavily on local knowledge and delayed reporting. Today, data science and AI allow us to provide a much clearer picture of market activity as it happens.”
“The Rural Property Sales Dashboard helps organisations move beyond static reports and gain direct access to transaction trends, sales activity and price movements across Australia’s farmland market.”
The DAS Australian Rural Property Sales Dashboard is used by financial institutions, government agencies, investors and agribusinesses to support lending, valuation, investment and strategic planning decisions.
DAS enriches and standardises rural property sales data from across Australia, transforming fragmented jurisdictional datasets into a nationally consistent benchmark with parcel-level accuracy. The platform is updated monthly, providing users with one of the most comprehensive views of the Australian rural property market available.
About DAS
DAS is an agri-fintech company transforming how financial institutions, governments and enterprises locate, finance, insure and invest in rural assets and portfolios. Its Rural Intelligence Platform™ serves more than 100 clients, integrating intelligence on land use, productivity, sustainability, risk and natural capital to support better decision-making across agriculture and regional economies.
Full Q1 2026 rural property sales analysis
National
| Q4 2025 Median PPH | Q1 2026 Median PPH | Change |
| $11,574/ha | $10,723/ha | -7.4% |
State-by-state breakdown: Median PPH shifts
| State | Q4 2025 | Q1 2026 | Change |
| Queensland | $11,149/ha | $12,064/ha | +8.2% |
| Victoria | $14,826/ha | $14,597/ha | -1.5% |
| New South Wales | $10,701/ha | $10,334/ha | -3.4% |
| South Australia | $10,265/ha | $9,344/ha | -9.0% |
| Western Australia | $9,869/ha | $7,434/ha | -24.7% |
South Australia Regional PPH Increases and Decreases
| Region | Q4 2025 | Q1 2026 | Change |
| Northern and Yorke | $1,132/ha | $11,240/ha | Significant uplift in median price per hectare, noting a low base in Q4 |
| Adelaide and Mount Lofty Ranges | $26,149/ha | $33,100/ha | +26.6% |
| South East | $16,607/ha | $14,650/ha | -11.8% |
| Eyre Peninsula | $7,076/ha | $2,935/ha | -58.5% |
| SA Murray Darling Basin | $7,018/ha | $5,807/ha | -17.2% |
Western Australia Regional PPH Increases and Decreases
| Region | Q4 2025 | Q1 2026 | Change |
| Peel-Harvey | $25,132/ha | $15,799/ha | -37.1% |
| Wheatbelt | $7,516/ha | $5,094/ha | -32.2% |
| South West | $15,378/ha | $11,715/ha | -23.8% |
| South Coast | $10,655/ha | $8,566/ha | -19.6% |
| Northern Agricultural | $7,230/ha | $6,335/ha | -12.4% |
Victoria Regional PPH Increases and Decreases
| Region | Q4 2025 | Q1 2026 | Change |
| Goulburn Broken | $13,536/ha | $19,576/ha | +44.6% |
| Glenelg Hopkins | $15,605/ha | $17,789/ha | +14.0% |
| Wimmera | $10,381/ha | $11,014/ha | +6.1% |
| North East | $20,460/ha | $11,116/ha | -45.7% |
| North Central | $13,636/ha | $7,533/ha | -44.8% |
| West Gippsland | $27,193/ha | $18,501/ha | -32.0% |
| Corangamite | $18,761/ha | $14,625/ha | -22.0% |
NSW Regional PPH Increases and Decreases
| Region | Q4 2025 | Q1 2026 | Change |
| Western NSW | $949/ha | $2,592/ha | +173.1% |
| Northern Tablelands | $7,359/ha | $9,571/ha | +30.1% |
| Riverina | $9,884/ha | $11,676/ha | +18.1% |
| North Coast | $16,413/ha | $18,542/ha | +13.0% |
| South East NSW | $11,767/ha | $12,735/ha | +8.2% |
| Central Tablelands | $14,217/ha | $11,789/ha | -17.1% |
| North West NSW | $10,805/ha | $9,088/ha | -15.9% |
| Central West | $4,684/ha | $4,225/ha | -9.8% |
| Hunter | $16,848/ha | $15,931/ha | -5.4% |
Queensland Regional PPH Increases and Decreases
| Region | Q4 2025 | Q1 2026 | Change |
| Burnett Mary | $10,115/ha | $16,411/ha | +62.2% |
| North Queensland Dry Tropics | $10,393/ha | $14,787/ha | +42.3% |
| Queensland Murray Darling Basin | $4,079/ha | $5,331/ha | +30.7% |
| South East Queensland | $16,303/ha | $20,941/ha | +28.4% |
| Condamine | $17,123/ha | $12,208/ha | -28.7% |
| Reef Catchments | $13,925/ha | $11,547/ha | -17.1% |
| Fitzroy Basin | $9,431/ha | $8,194/ha | -13.1% |
* ACT and Tasmania excluded from analysis due to small sample sizes
