In a year when the eastern states have either been drowning under floods or gasping through drought, and here in the west half the state has been left staring at a dry horizon, it seemed timely to stop watching the skies and start digging into the past.
Instead of relying on the usual long-range forecasts—which, let’s be honest, have been about as useful as a rain gauge in a sandstorm—I decided to look back at the historical record of wet and dry cycles across the Wheatbelt to see what it tells us about real climate change.
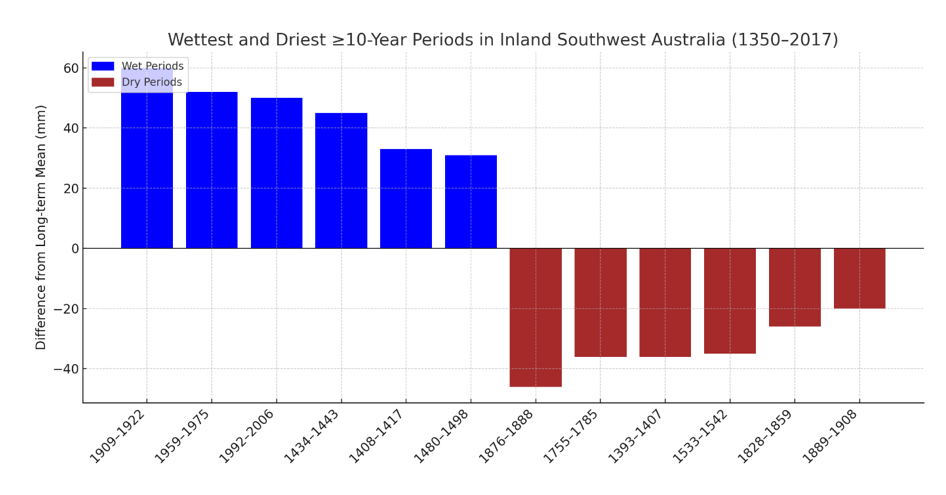
Source: Trevor Whittington, from data sourced from Megadroughts and Pluvials in Southwest Australia: 1350–2017 CE
What I aim to do is cut through the rising noise between the climate catastrophists shouting Armageddon and the hardened sceptics waving it all away, versus the climate fatalists like me—convinced that, whatever humans do, nature already has the final say—and put some facts on the table.
To do this, I found one piece of academic research that makes for essential reading: a peer-reviewed scientific paper examining 700 years of rainfall patterns for the southern half of Western Australia—about as close to the Wheatbelt as we’re likely to get—which, when cross-referenced with global climate proxies, gives a solid sense of what our annual rainfall might have looked like had WA’s first settlers arrived in 1350 instead of 1829.
Now, before your eyes glaze over at “peer-reviewed” or “global climate proxies,” hear me out. This isn’t your usual climate debate fodder—it’s rigorous historical insight that reframes what we know about modern rainfall patterns and helps us judge whether the drying cycle we keep being told began in the 1990s is the beginning of the end or just another chapter in the never-ending climate story.
The scientific article—written by a group of climatologists and historians—reconstructs rainfall records using tree rings, Antarctic ice cores, and Southeast Asian drought archives to deliver a sobering reality check: rainfall in the Wheatbelt has always ebbed and flowed, long before CO2 became the popular scapegoat.
This long-view perspective unsettles the current doomsayers’ narrative that only recent emissions have caused disruption—a claim based on little more than a century of data, treated as gospel by policymakers keen to pin every weather event on fossil fuels.
But a mere century barely scratches the surface. As the article points out, climate history unfolds in cycles. Making sweeping, irreversible policy decisions based on the short window of high CO2 emissions, as a critical reader can surmise, borders on the absurd.
The paper, Megadroughts and Pluvials in Southwest Australia: 1350–2017 CE, focuses on trees growing around Lake Walyormouring, just north of Southern Cross. The big salt lakes provided a natural firebreak, preserving a slow-growing, long-lived conifer, Callitris columellaris—a climate-sensitive native that has left us with a precious record of annual growth rings. With its 200–300 mm rainfall mimicking much of the eastern Wheatbelt, the shallow roots are highly reflective of seasonal moisture, allowing a continuous sequence from 1350 to 2017 CE to be built from both living and dead specimens.
To ensure accuracy, the tree-ring data was calibrated against instrumental rainfall records from 1900 onwards. This showed a strong correlation to the record of wet and dry years, confirmed by other historical data, indicating that the tree data accurately captured both short-term variation and long-term shifts. The reconstructed record makes for interesting reading—especially when you consider that our rainfall patterns are mirrored in what is happening from the paddy fields of Asia to Antarctica.
Major drought periods – Wheatbelt and SE Asia
1570s–1590s
- Brief dry spell
- Linked to droughts in Burma and Thailand (tree rings, rice shortages)
1670–1710
- Prolonged WA dry phase
- Coincides with Southeast Asia’s “Strange Parallels” drought
1770–1800
- One of WA’s longest megadroughts
- Matches Vietnam/Java droughts, linked to volcanic activity
1820–1835
- Drought continued across WA and SE Asia
- Historical famine and colonial hardship documented
1880s
- Severe dry years across WA
- Matches monsoon failure in India and Indonesia
Post-2000 Decline
- Not unprecedented, but notable
- Parallels weakening monsoon onset in SE Asia
Major wet periods – Pluvials
1400–1420
- First major pluvial in record
- Matches wetter conditions in Cambodia and Laos
1650–1680
- Sustained wet decades
- Confirmed by Bangkok river flood sediment records
1950–1999
- Wettest 50-year stretch on record
- Linked to stronger tropics rainfall and Himalayan snowpack
These findings show that natural rainfall variability includes both gradual shifts and sudden swings. This directly contests the claim that recent declines are without precedent.
For instance, the period from 1950 to 1999 was among the wettest in the entire 700-year span, while the recent post-2000 decline, though worrying, falls within natural variability. The study urges caution in blaming short-term trends solely on human activity.
The authors also explored broader climate linkages, comparing their reconstruction with Antarctic ice core data and drought indices from Southeast Asia. Despite the geographic distances, significant overlaps emerged between WA droughts, Southeast Asian dry spells, and low snowfall years in Antarctica.
These linkages suggest wider Southern Hemisphere climate dynamics—likely influenced by shifts in atmospheric circulation and ocean temperatures. Crucially, Pacific Ocean phenomena like El Niño and La Niña had only weak, inconsistent ties to Wheatbelt rainfall. While ENSO affects parts of Australia, it’s not a reliable long-term indicator for southwest WA.
More robust correlations appeared with global climate drivers like the Indian Ocean Dipole and Southern Annular Mode, pointing to a broader hemispheric pattern behind the Wheatbelt’s climate shifts.
The rainfall record also dovetails with WA’s historical written drought accounts from the 1830s onward. Dry spells in the 1840s and 1880s, for example, show up clearly in the tree-ring data, validating both the method and the historical accounts.
These findings confirm what many seasoned farmers already sense: the Wheatbelt has always seen dramatic swings in rainfall. What’s new is that modern farming systems are far more capable of dealing with these swings than our forebears were. To date, no part of the Wheatbelt has been abandoned and valued at $0 an acre due to recent dry decades. In fact, I’d wager that if we threw open the line from Southern Cross to Salmon Gums, the government would see willing buyers heading out there with their dozers and chains to relive the glory days of opening up new country.
This perspective challenges the common narrative, where just a century of measured weather data has become the holy writ, confidently cited by policymakers eager to pin every climatic hiccup on fossil fuels. Indeed, the authors compellingly illustrate that a hundred years of data barely captures the essence of the rainfall story, which unfolds in longer cycles—10-year trends nest within 30-year cycles, all swirling within broader 100-year epochs. Attempting to formulate irreversible global policy on the basis of such a slender sliver of history, as the article politely hints, borders on the absurd.
So what are the takeaways from the paper? First, consider their findings regarding historical rainfall cycles: the Wheatbelt’s precipitation has fluctuated dramatically, often by one or two inches a year over decade-long periods above or below the long-term average. Imagine today’s technology applied to past centuries, especially during rainfall-rich periods identified around 400 and 700 years ago.
We could have effectively doubled the Wheatbelt, clearing lands which receive a steady 250–300 mm annually, vastly expanding our productive acreage—farmland that we could crop today, even if it’s just in a year-in-year-out rotation, as parts of the eastern Wheatbelt and Queensland currently do. The historical evidence suggests we missed a golden opportunity post-war and could well miss future ones—ironically because we lacked today’s knowledge of past rainfall cycles, not because of any shortage of rain.
This leads to my second takeaway: recognising rainfall variability as cyclical rather than linear or consistently diminishing. The research clearly identifies prolonged phases where rainfall increases or decreases over decades, often confounding predictions and confusing short-term policy responses. These patterns offer cold comfort to alarmists who insist on definitive projections of doom. Yet, they also gently caution the optimists.
Then comes perhaps the article’s most provocative revelation—my third takeaway: the significant human-driven climatic impact in the Wheatbelt, far from being tied exclusively to global industrial activity, has likely been more dramatically affected by natural climate variation and, in part, by land clearing since World War II.
Clearing vast swathes of the Eastern Wheatbelt arguably disrupted local rainfall patterns far more immediately than rising global CO2 levels have to date. The regionalised climatic shift following mass clearing—one our fathers and grandfathers were hard at—challenges simplistic global warming narratives by underscoring localised human interventions as critical climatic drivers.
For broadacre farmers accustomed to enduring both climate anxiety and scepticism, these insights form an indispensable toolset. Whether you’re debating climate change policies at the pub, or simply trying to put in context this season’s late-May break, the academic depth provided by this paper should be quoted regularly with historical precedence. It arms you against both fear-mongering catastrophists demanding immediate, economy-wide upheaval, and blinkered deniers stubbornly ignoring humanity’s clear, if localised, environmental impacts—be it CO2 or the fact that clearing the land has had an impact on rainfall.
Fourthly, this historical perspective offers reassurance to those like myself—the fatalists—who understand human limitations clearly. It demonstrates how natural climatic oscillations dwarf our modern industrial efforts to sway global weather patterns significantly. Yet, it also firmly grounds the argument that our ancestors’ land-management decision to clear the Wheatbelt was viable—in fact, we probably should have cleared more.
Indeed, the Wheatbelt’s climate resilience hinges less on global political posturing demanding the government do more—which far too many farmers have signed up to—and instead focus on more on pragmatic, adaptable farming strategies informed by long-term climatic realities. Those realities, encapsulated brilliantly in this essential research, highlight the genuine folly of expecting the past century’s incomplete data to drive global policy.
Finally, the authors advocate expanding such studies across southern Australia. More funding should go to this kind of palaeoclimate work—possibly through the endless bucket of the Drought Hub multi-billion-dollar fund. I’d wager that farmers would be far more interested in peer-reviewed science that delves into short- and long-term rainfall cycles in their region than in some of the politically correct projects the Drought Hub has funded so far. Case in point: the Maaman Marra Boodjar project, which blends Aboriginal place-based knowledge with contemporary agricultural practices to enhance drought resilience. Seriously.
In fact, if the WA Agriculture Minister wants to get ahead of the next drought, then putting some DPIRD dollars into extending the tree-ring work to help lock in a timeline of what short- or long-term cycle we are in—along with funding the final part of the very practical DPIRD Water Smart program that’s mapping and encouraging farmers to access the vast amounts of semi-saline groundwater (between 2000–10,000 ppm salt) that sits untapped 100m below their properties—then she will have made a real mark on both drought cycle planning along with resilience. The Lake Walyormouring’s rainfall story reminds us just how extreme the Wheatbelt’s rainfall can be. It also offers hope. The next wet period might be just around the corner. Or maybe we’re at the start of another mega 30-year drought, where average rainfall falls by just an inch or so—either way we need more information, less climate change hysteria and more practical government programs to encourage preparedness.
Thanks Trevor. Good article. The data you quote is supported by tree ring studies by Cullen in 2009 at Lake Tay ( located betweeen Ravensthorpe and Salmon Gums). However Government policy is now based on climate change modelling that only uses data since 1950. Naturally these models predict a continuing decline in rainfall for the south-west, by as much as half.. The Government is supportting this work with a grant of $3 million and is rapidly decarbonising in a futile attempt to change the climate. (For a detailed discussion see Bad Models and Worse Science , Quadrant, November 2024). Frank Batini ( forester, enviromental scientist)
Excellent article Trevor, a fresh look at what many believe to be Gospel according to man.