
John O’Donnell
There is little prescribed burning area data across Australia and the states/ territories. New information by Canadell et al (2021) “Supplementary Information for Multi-decadal increase of forest burned area in Australia is linked to climate change” includes a useful figure in relation to prescribed burning assessed against wildfire area for each state.
This information is included as Figure 1 below and the article author appreciates the approval to use this information for this article.
The supplementary information paper is linked to the main paper by Canadell et al (2021) titled “Multi-decadal increase of forest burned area in Australia is linked to climate change” (Nature Communications).
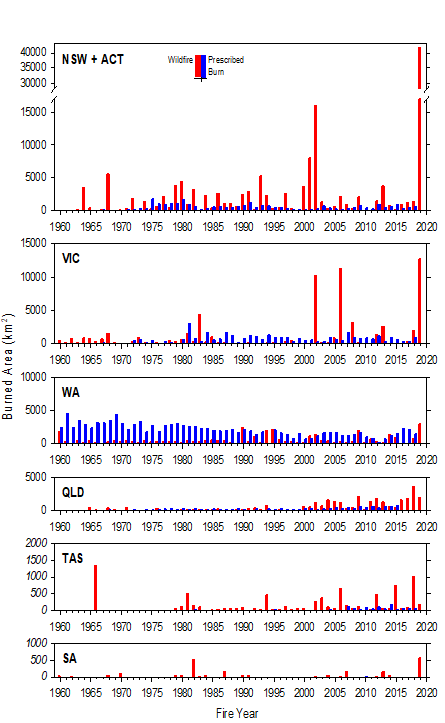
Figure 1. Burned area (km2) of wildfires and prescribed burns for 1960 to 2019 fire year by States and Territories. NSW+ACT: New South Wales and Australian Capital Territory; VIC: Victoria; WA: Western Australia; QLD: Queensland; TAS: Tasmania; SA: South Australia. Data: State and Territory agencies (1960-2018) and MODIS (2019). Source: Canadellet al (2021) Supplementary Information for Multi-decadal increase of forest burned area in Australia is linked to climate change Supplementary Figure 4
Forest ecosystems distribution used in the Canadell et al. (2021) study (Figure 9) include the following vegetation types from the Australian National Forest Inventory (250 m spatial resolution): Eucalypt low closed, Eucalypt low open, Eucalypt low woodland, Eucalypt medium closed, Eucalypt medium open, Eucalypt medium woodland, Eucalypt tall closed, Eucalypt tall open, Eucalypt tall woodlands, Rainforest, Leptospermum, Banksia, Other native forest, Softwood plantation, Hardwood plantation, Mixed species plantation and Other forests (unallocated types).
Nominal forest types occurring in savanna, rangeland, and littoral ecosystems are not included: Callitris, Casuarina, Eucalypt Mallee, Mangrove and Melaleuca.
The author of this article does have some concerns about some of the data in Figure 1 for NSW and likely other eastern states, including bushfire area estimates in particular bushfire years; possibly missed prescribed burning areas in NSW around the year 2000 and possibly underestimated past prescribed burning before satellite imagery. Noting the above concerns, the graphs for each state in Figure 1 appear broadly indicative for each state and provide useful data for discussion purposes.
In relation to the Western Australia Figure 1 dataset, interpretation of this data by the author of this article includes the following observations:
- Prescribed burning has been at high (60s and 70s) to fairly high levels, with some variation, over the full range of the data set.
- Prescribed burning area has overtopped wildfire burn area in a very large way in a large number of years.
- Wildfire burn area has been higher than prescribed burning in a small number of years.
- There have not been extreme peaks in wildfire burn area over the dataset, this is to be commended.
In conclusion, there has been a well-managed prescribed burning program across much of the landscape in place, but there is a downward trend that needs to be addressed if possible.
This Western Australia data is consistent with other research papers, including “The Truth About Fuel Reduction Burning” on the Bushfire Front website. This document addresses real data gathered from almost 60 years of historical data from the forests of south west WA which unequivocally shows that when the area of prescribed burning trends down, the area of uncontrolled bushfires (wildfires) trends up.
As noted in this paper, there is a simple explanation: bushfires are more difficult to put out in long unburnt, heavy fuels. The area annually burnt by bushfire escalates exponentially when the area of prescribed burning in a region falls below 8% per annum. Burning about 8% per annum results in about 40% of bushland carrying fuels 0 to 5 years old.
In relation to the NSW/ ACT Figure 1 dataset, interpretation of this data by the author of this article includes the following observations:
- Prescribed burning has been very low over the full range of the data set, noting some increased areas were undertaken between 1975 to 1991.
- Prescribed burning has been higher than wildfire burn area in a small-moderate number of years, notably when wildfire burn area is at a low level.
- Wildfire burn area has overtopped prescribed burning area in a very large way in a large number of years.
- There have been extreme peaks in wildfire burn area in many years over the dataset.
- In conclusion, there is a long term inadequate prescribed burning program across the landscape in place that needs to be urgently addressed.
In relation to the Victorian Figure 1 dataset, interpretation of this data by the author of this article includes the following observations:
- Prescribed burning has been very low over the full range of the data set, noting some increased areas were undertaken between 1981 to 1994.
- Prescribed burning is higher than wildfire burn area in a small-moderate number of years, notably when wildfire burn area is at a low level.
- Wildfire burn area has overtopped prescribed burning area in a very large way in a number of years.
- There have been extreme peaks in wildfire burn area in many years over the dataset.
- In conclusion, there appears to be a long term inadequate prescribed burning program across the landscape in place and there is a downward trend that needs to be urgently addressed. This issue has been raised as an issue following the 2009 Victorian bushfires, but revised prescribed burning targets never reached the required levels and the more recent focus has been to focus prescribed burning near infrastructure such as towns and cities.
The reader can interpret the results for the other states.
There is an urgent need to increase prescribed/ ecological maintenance/ cultural burning across eastern state landscapes.
In addition, there is no provision of wildfire area and prescribed burn area information across Australia and the states and territories on an annual basis. This information can be collected by satellites. This information would be easy to provide on an annual basis so that the community might be well-informed on the issue, assess information about required target areas and assess areas exposed to wildfires. The information also could be used in fire authority reports.
About John O’Donnell
John is a retired district forester and environmental manager for hydro-electric construction and road construction projects. His main interests are mild maintenance burning of forests, trying to change the culture of massive fuel loads in our forests setting up large bushfires, establishing healthy and safe landscapes, fire fighter safety, as well as town and city bushfire safety.
