
Frank Batini
This remarkable project was, at the time, the longest water pipeline ever constructed in the world.
Inspired by C Y O’Connor, the Chief Engineer for the Public Works Department, supported by J. Forrest, the Premier and costing an eye-watering 2.5 million pounds of borrowed money, the work was completed in early 1903 when the first pump was turned on. Water arrived in Kalgoorlie two days later. Unfortunately C Y O’Connor did not share in this success, as he had committed suicide at South Beach about nine months earlier, hounded by Politicians and the Press.
The project consisted of a dam (Mundaring Weir) to trap stream-flow from the Helena, Darkin, little Darkin, Pickering and Beraking brooks, a 566 kilometre pipeline, eight stream-driven pumping stations fuelled by timber and several storage reservoirs. Fifty years later electricity replaced fuel-wood and steam as the power source.
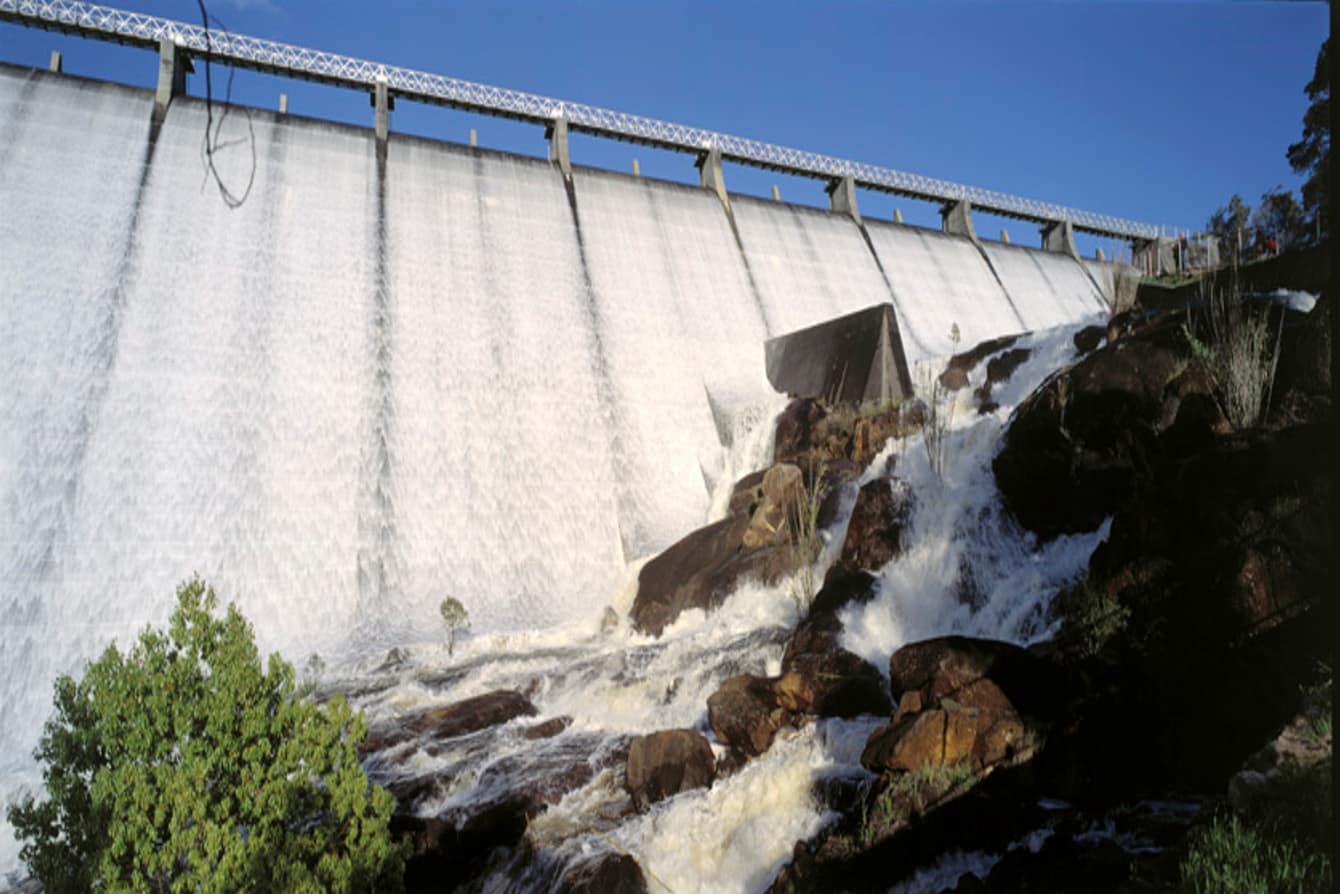
Photo: Batty Library of WA.
The initial capacity of Mundaring Weir was 19590 million litres, roughly two years supply. To cater for increasing demand from the Goldfields and the agricultural areas, the dam wall was raised in 1951 by nearly ten metres, to 63600 million litres and again in 1959, to 72290 million litres. Despite an increase in storage capacity of 370 percent, the Weir periodically overflowed between the 1940’s and 1960’s and my family were among the many visitors. In 1971 a pipe-head dam was constructed on the lower Helena river and a pump-back scheme installed.
There were concerns that the storage was filling too slowly and about 5000 hectares of forest adjacent to the dam were ring-barked between 1905 and 1908 to reduce transpiration and increase flow. These forests regenerated vigorously from lignotubers and coppice. Concurrently, a number of small farm holdings were resumed to improve water quality and most were then planted to pine. During summer 1958/59, prior to entering University, I worked for the Forests Department in these plantations, felling pine.
Fuel-wood to heat the boilers and produce the steam that powered pumps number 1 and 2 was sourced from the predominantly jarrah (E marginata) forest that surrounds the Weir. Between 50 and 100 men were employed in cutting and carting. To provide wood for the pumps 3, 4 and 5, located in the “wheat belt”, a number of timber and other reserves were created nearby. A Timber and a Public Utility reserve located just west of Bodallin, were established to service pump number 5, at Yerbillon, about 300 kms east of Perth.
During the 1980’s my family spent many holidays with the Bligh family, who owned the farm adjacent to these reserves and we would walk and ride horses through these beautiful areas. Despite being harvested for fuel-wood, the woodlands of salmon gum, York gum and gimlet regenerated successfully and the regrowth is now 70 to 120 years old. These areas total 1920 hectares of sandplain and woodland vegetation within an agricultural landscape. Their value for conservation was eventually recognised by designating these as Nature reserves in 1979.
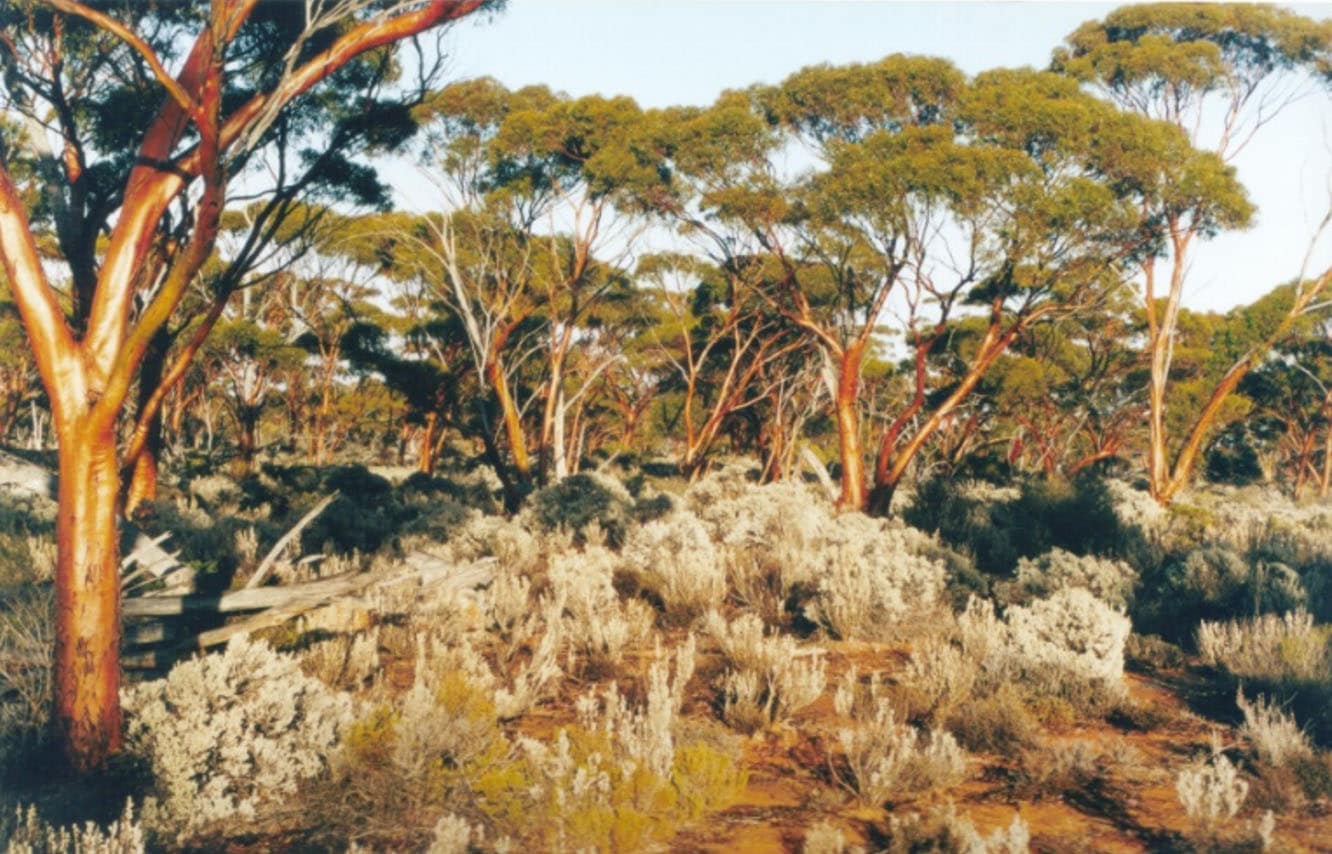
Photo: Frank Batini.
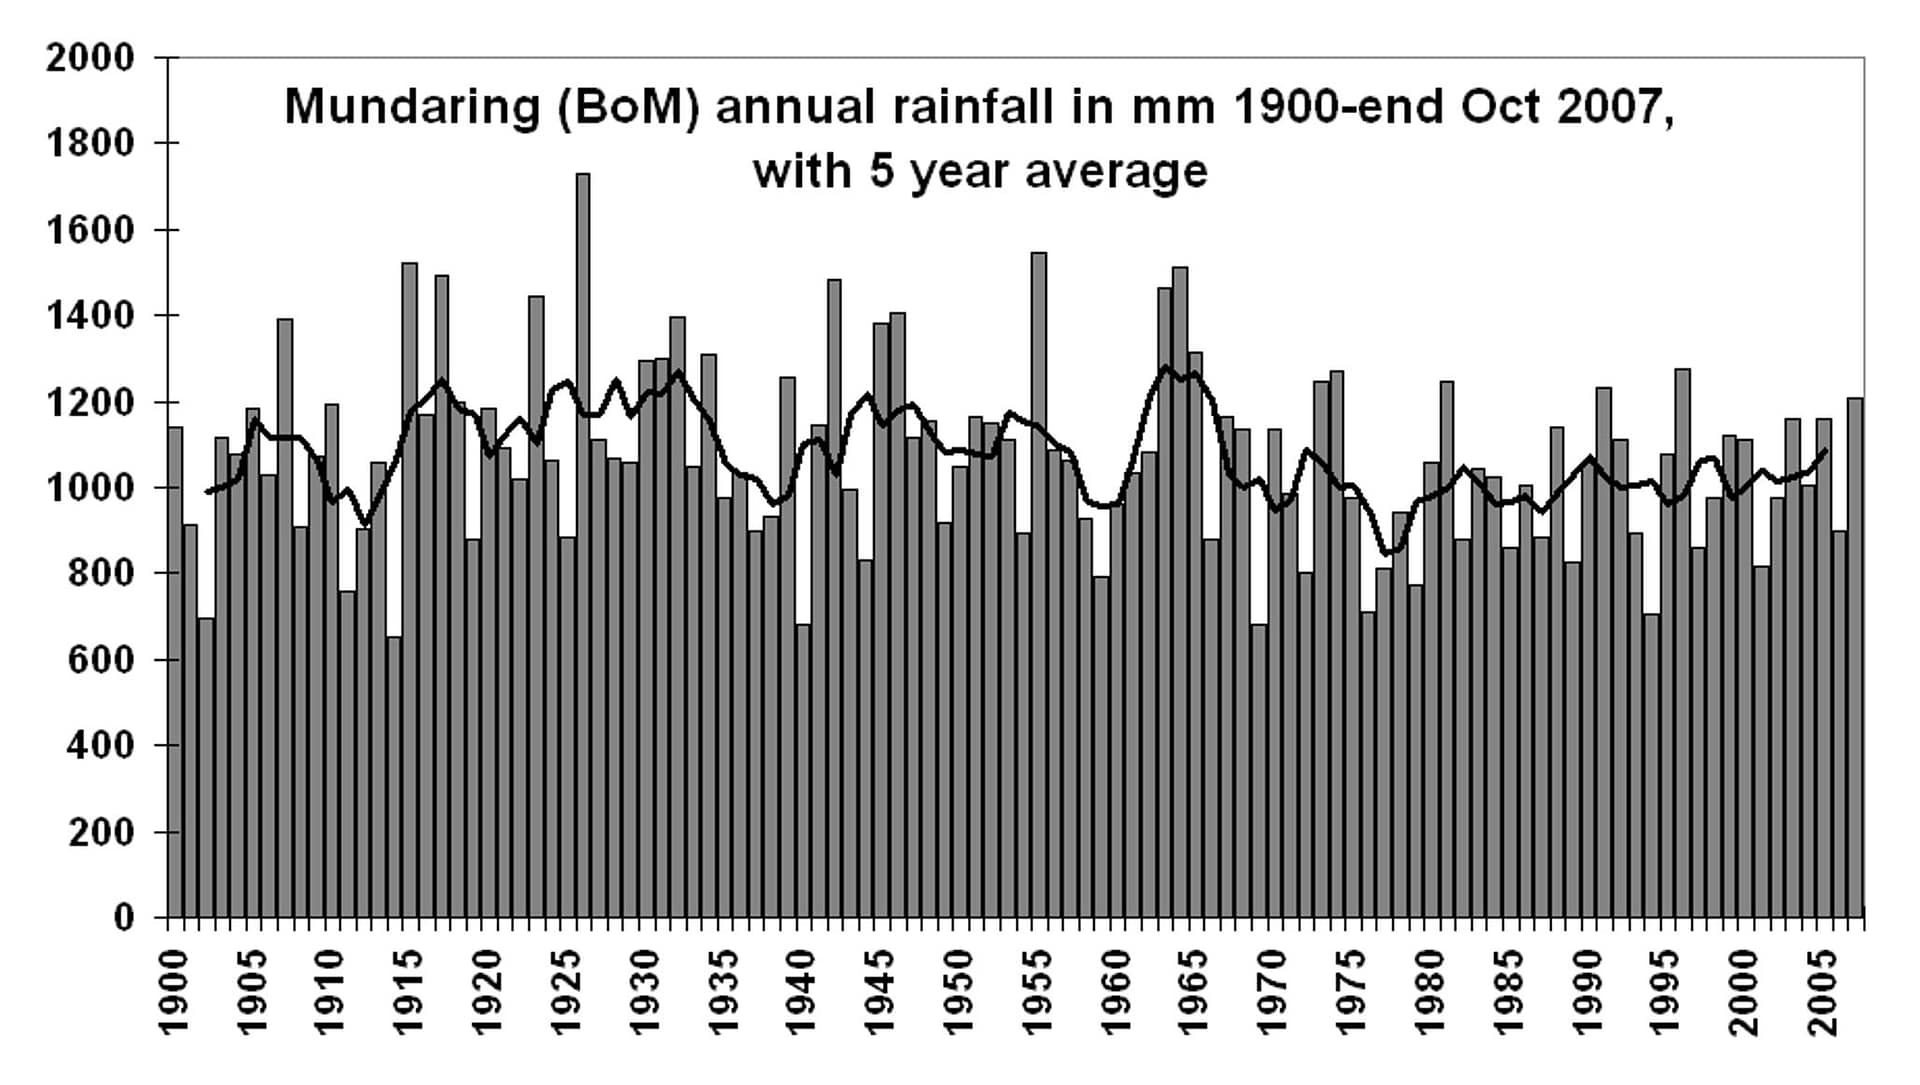
I have wondered why, despite the initial concern at the slow rate of filling in the early 1900’s, storage capacity could be substantially increased, yet overflow still occurred. Rainfall was obtained from the Bureau of Meteorology (BOM) for Mundaring for 108 years, from 1900 to 2007. Data include annual, mean (1042mm), lowest (562mm) and highest (1588mm) in 1926.
Rainfall at the beginning of the century (1900-1909) during which the dam was filling averaged 1053mm, which is close to the 108 year mean. 1902 was the only very dry winter (697mm) and 1907 was wet (1392mm). The overflows which occurred in 1903 and 1907 suggest that the decision to ringbark such a large area of forest was premature and unnecessary. Rainfall by the end of the century (1992 to 2001) averaged 914 mm, a decrease of 12 per cent from the mean.
The rainfall/runoff relationships in these catchments are highly non-linear and it is the years of very high rainfall that replenish the streams, fill the dams and may even lead to flooding downstream. An example was while I was working at Harvey in 1964, when heavy rain (in 1963 and also 1964) caused large flows over the spillway and threatened to breach the Harvey Weir wall. As a result Harvey was evacuated for about a week. . Mundaring Weir overflowed first in 1903, for a period of two weeks and it last overflowed in 1996 (see photo). Storage levels in 1996 would have been increased by pumping water from the lower Helena pipehead dam.
Data show that all years of high (> 1331mm) rainfall were recorded between 1907 and 1964, which is consistent with other rainfall records. These observations are supported by tree-ring studies at the University of Western Australia which reveal evidence of cyclic trends in rainfall in the south-west of WA, with several multi-decadal very dry periods extending back well before European settlement (and much lower levels of carbon dioxide). The authors conclude that the first half of the 20th Century was the wettest period since 1350 CE. These studies help explain why stream-flow was able to regularly fill and spill-over Mundaring Weir, even though the original storage had been increased substantially.
Many have expressed concern at lower rainfall, falling water-tables and declining runoff since the 1970’s, and have blamed “climate change”, not appreciating that drier is the default condition for this part of WA and that it was the wetter decades that were unusual. Increased rainfall between 1907 and 1965 led to waterlogging and salinity concerns on farms, to rising damp and salt damage to buildings in low-lying wheatbelt towns, to increased damage by the Phytopthora disease in the jarrah (E marginata) forest and to the migration uphill of water-loving species such as bullich (E megacarpa).
Frank Batini is a forester, environmental scientist and Consultant in Natural Resource Management.
I am interested in analysing long-term rainfall records and trends, and relating rainfall data to biophysical events. I am concerned that BOM is now using only 30 years to calculate average rainfall. The current average for Perth is given as 699 mm whereas the 140 year mean is 844 mm, which is 21 per cent higher! Also 30 years does not allow any analysis of cyclical trends over time, for example a dry-wet-dry sequence,as I have observed with my analyses of long-term rainfall data for the jarrah forest: Frank Batini.
