
Steven as a Service (SaaS), March 2025
With the Federal Election looming, and your ‘Power Bill’ being one of the key campaign topics, we should all strive to better understand how our electricity usage is captured, measured and billed, so we manage how it affects us – taking some power back (pun absolutely intended).
Let this article clarify a few fundamental points and offer better understanding.
The basics
When it comes to your power bill calculation clear your mind and think of 3 core elements, and the equation, A x B = C.
The biggest impacting factor to the price of your bill
is – your usage data! (Element A)
Your *bill is (and should only be) calculated by: units of usage x rates = bill price.
(*at the initial level – discounts and other add-ons are applied after this calculation).
Your usage data is therefore, the element you must focus on the most, as rates come secondary to this. The explanation as to why is in the next section.
Usage data file types
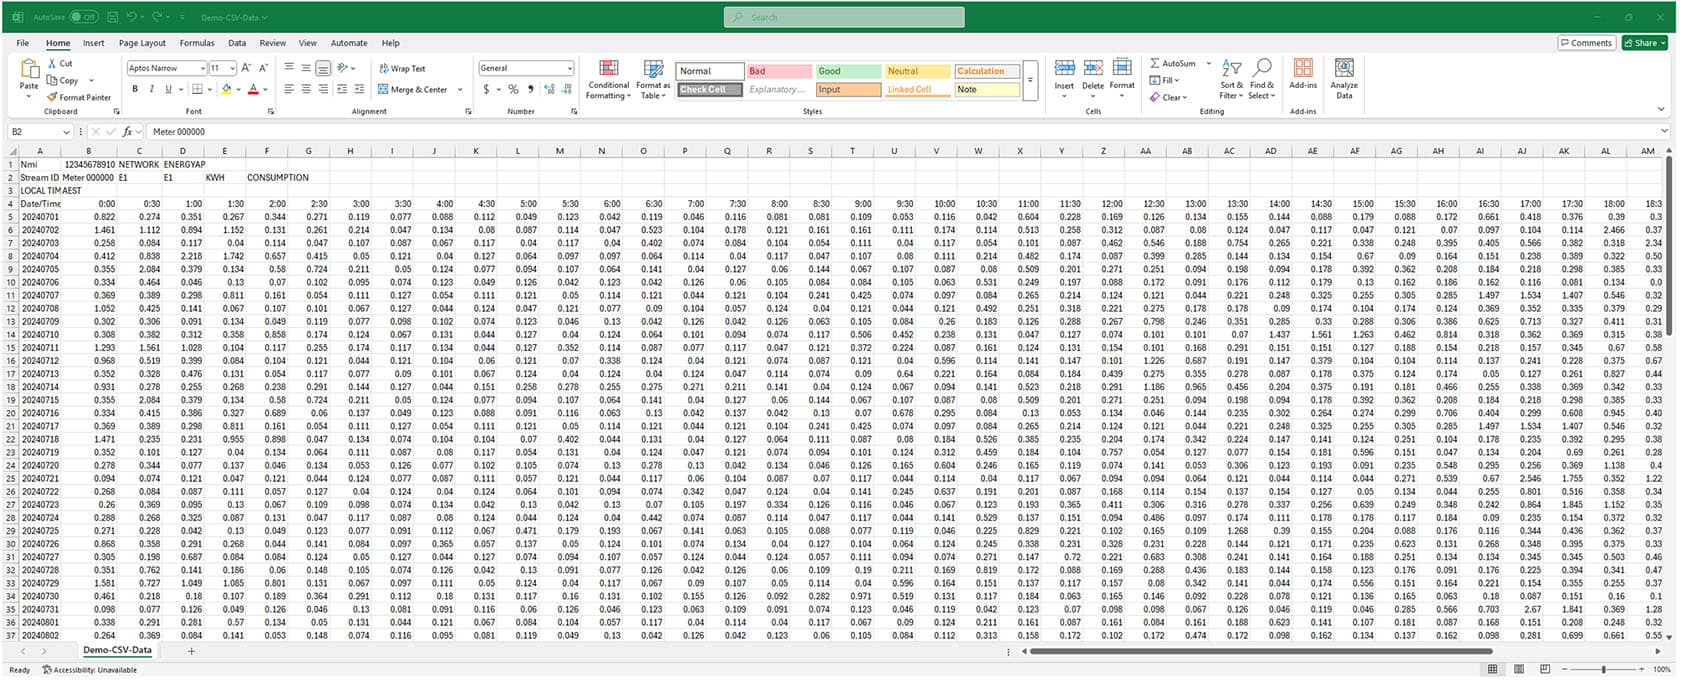
NEM12 (interval data files)
– Rows: Each row represents an interval of energy usage (e.g. 30-minute or 5-minute intervals). There are typically multiple rows for each day, depending on the interval length.
– Columns: Includes fields such as the meter identifier, date, time, energy consumption data (interval readings), quality flag (indicating data reliability), and other metadata.
NEM13 (accumulated data files)
– Rows: One row per meter read period (e.g. one row for each billing cycle).
– Columns: Contains fields like meter identifier, start date, end date, total accumulated energy usage, and metadata such as data quality flags.
Why?
FACT – Your bill is incorrect if your accurate^ usage data is not applied correctly.
^By this I mean the dates and times quoted on your bill must be the same dates and times your recorded ‘actual read’ usage data reflects. You may think this is obvious however, it tends to be a culprit of anomalies.
How?
Usage data varies the calculated price (Element C)
Example – same plan, different consumers
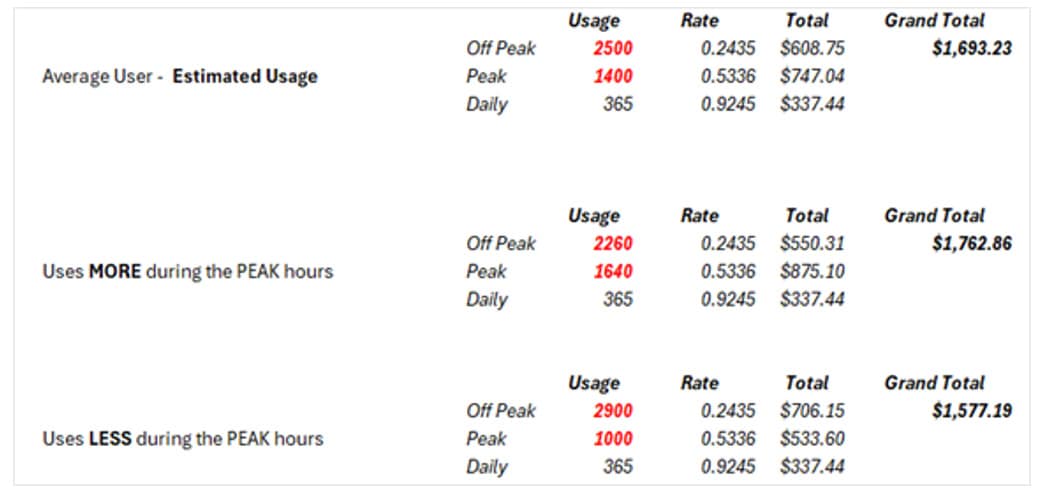
- The above rates are current rates sourced from energymadeeasy.gov.au
- The usage amounts are examples to show how it varies the price.
- Hence consumers should always personalise comparisons with their usage data.
- Note: 3900 kWh has been used to maintain a consistent level of discussion, to demonstrate the impact of different usage amounts have on the resulting price.
- In reality your own personal usage will be different, and so add to the differential.
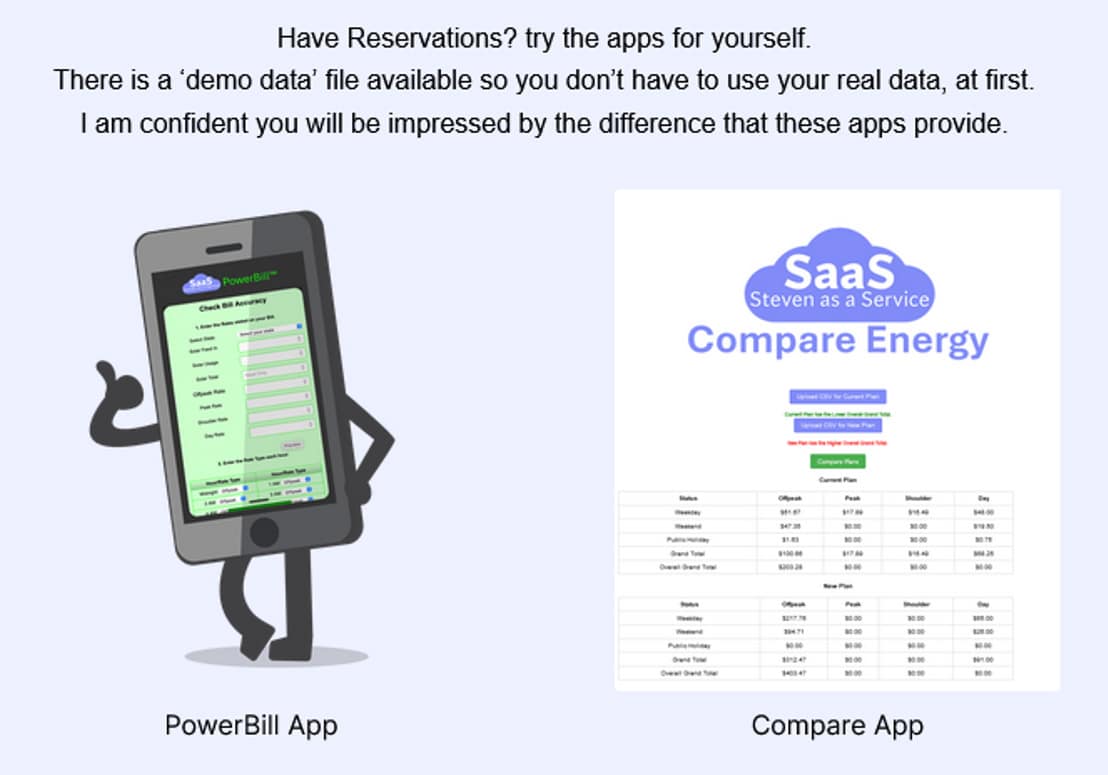
Below is a list of all the plans compared against each other, using real usage data – this is also the ‘Demo Data’ available on the Format page).
Advantages of using your usage data
1. You can personalise plan comparisons
Compare apples and oranges using your usage data as the ‘anchor’ to generate a result that makes absolute sense.
This is a first in the comparison market, bringing a dynamic new perspective to comparison services and only available through my PowerBill™ and Compare apps.
Personal story
I recently compared 2 plans to find a better deal, and honed-in on; a ‘Single Rate’ plan, and a ‘Time of Use’ plan.
My initial preference was the single rate plan, however after running my usage data against each plan through my apps, the ‘Time of Use’ plan was actually less expensive, so I switched to that plan.
Reinforcing that it depends on your usage data/usage patterns.
Below is a similar comparison.
Same usage data, different plan types.
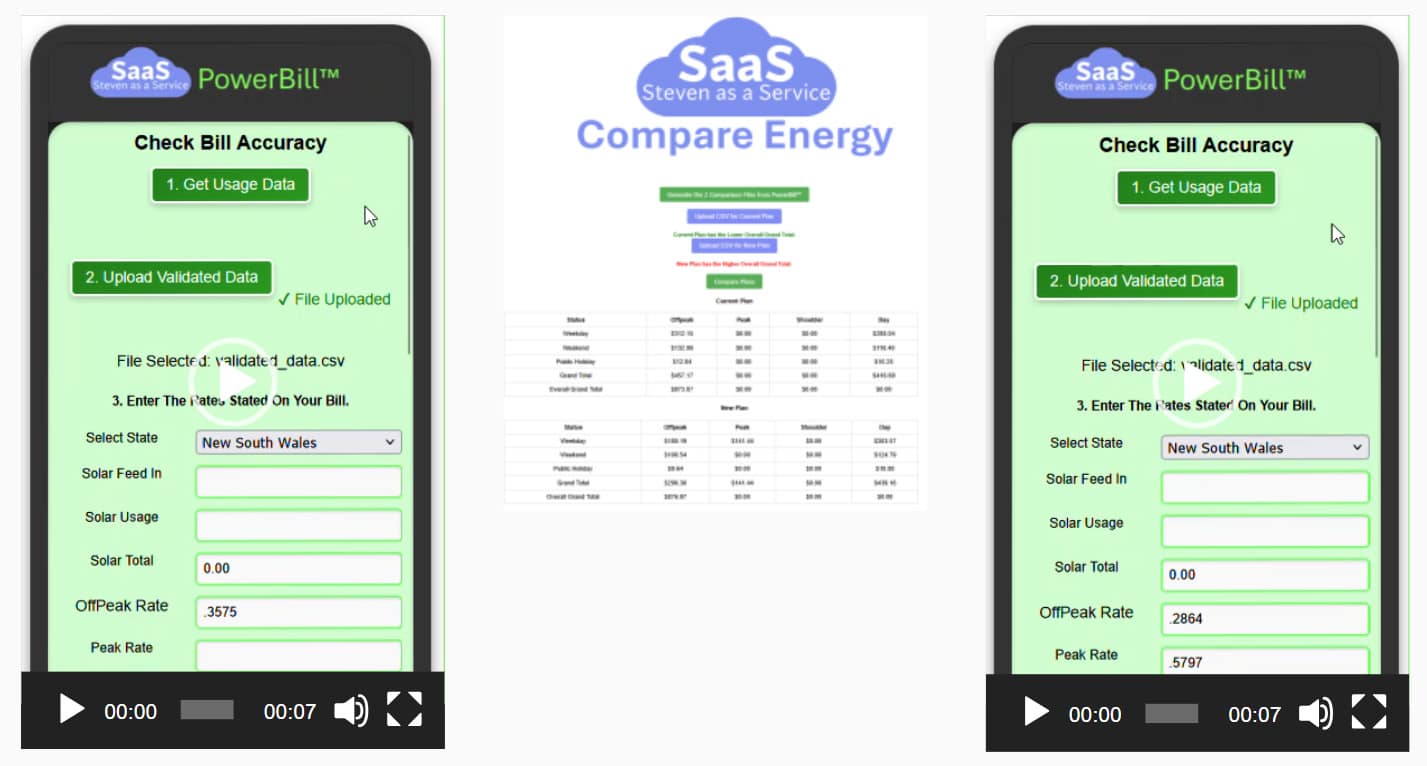
Play the clips to see the demo at
https://mysaas.website/power-bill-facts-you-need-to-know/
2. You can check your current bills accuracy
Ensure that you are being billed correctly in the first place, and if not approach retailers with confidence when it comes to bill anomalies.
My PowerBill™ app takes the stress out of the process, by quickly giving you hour-by-hour day-by-day price data, that proves a bills amount, which you can download and send off to retailers to request refunds, if you find anomalies.
Privacy assured
- No personal identifiers are taken or used within the process.
- Any information used (namely the usage data) is wiped when you clear your browser history.
Free of charge
You are NOT required to:
- Provide: Name, email, address, phone number, to receive the comparison results.
- Pay to access and use the apps, they are free of charge.
- Pay to receive the Comparison results or Bill Check summary data.
Out with the old
You no longer need to search energy plans by using standardised consumer metrics.
Ask yourself:
- Do I have exactly the same property/home as the next person?
- Do I have exactly the same appliances and devices?
- Do I use them all at the same time and in the same way as everyone else?
It cannot be realistic or accurate to base your energy bill costs on the idea that your usage is the same as another consumers.
Observations of current market prices and information
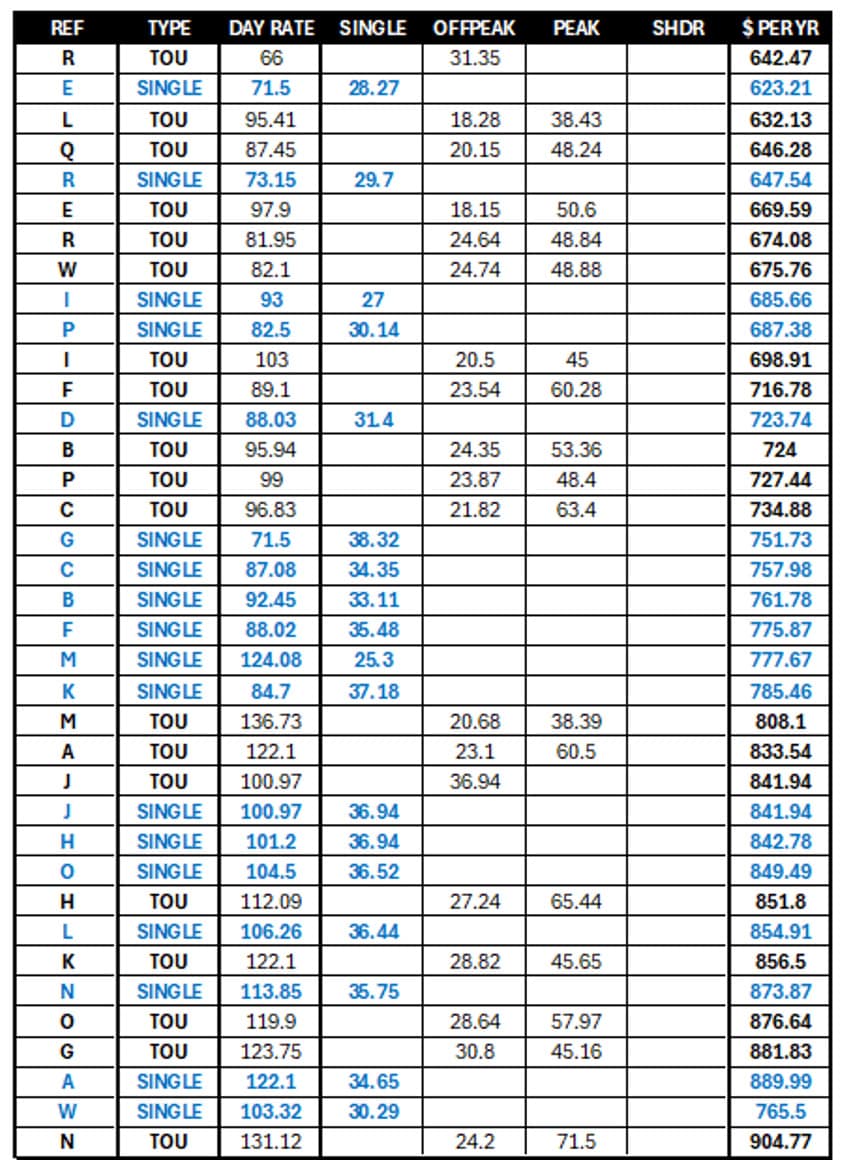
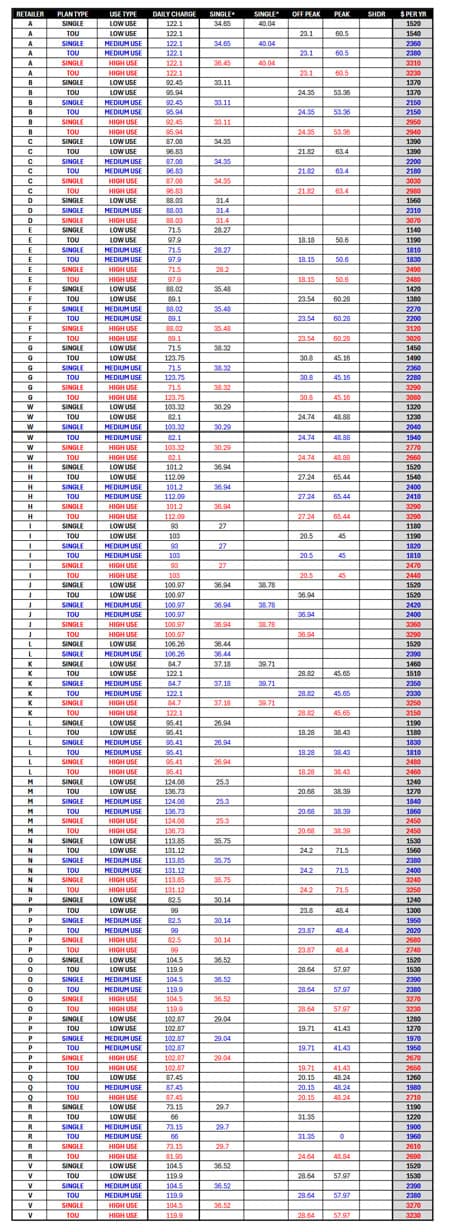
Rates (Element B) are mostly the same
Most retailers have the same rates (within their own range of plans across the Low, Medium and High Use bands). See diagram.
- Daily rate,
- Single rate,
- Peak rate,
- Off Peak rate.
It becomes a little less confusing when you know this, doesn’t it?
Analysis shows the rates in groupings of: Low, Medium and High use and each group.
- Lists the two ‘Plan Types’: Single rate or Time of Use (TOU),
- The rates applicable to the plan type,
- The retailer providing the plan,
- An estimated ‘Yearly Cost’ (based on average estimated household Usage/Consumption of 3900Kwh).
- Note: You may consume more or less than 3900 kWh, so be mindful of the estimated cost highlighted as a guide to the plan (it could subtly influence your thoughts into thinking your yearly price is likely to be that, and potentially lead to bill shock due to the misunderstanding).
So what do consumers do now?
1. Download your usage data
Now that you know it’s the key to comparing plans and checking your bills accuracy!
Use the one-stop-shop directory of the Distributors and Retailers across Australia. Click the link below to select yours and download your data.
2. Use these game changing apps
To test the apps go to mysaas.website
When the market realises that Usage Data is the main driving force to providing competitive energy plan comparisons and accurate bill calculations, they will all need to do it this way
Hence why PowerBill™ and Compare are game changers!
Powerful when used together
This is a full end-to-end Demo.
- Element A 1. Get Data. 2. Format Data.
- Element B 3. Enter Rates. 4. Select Rate Type.
- Element C 5. Show Price. 6. Get Priced Data.
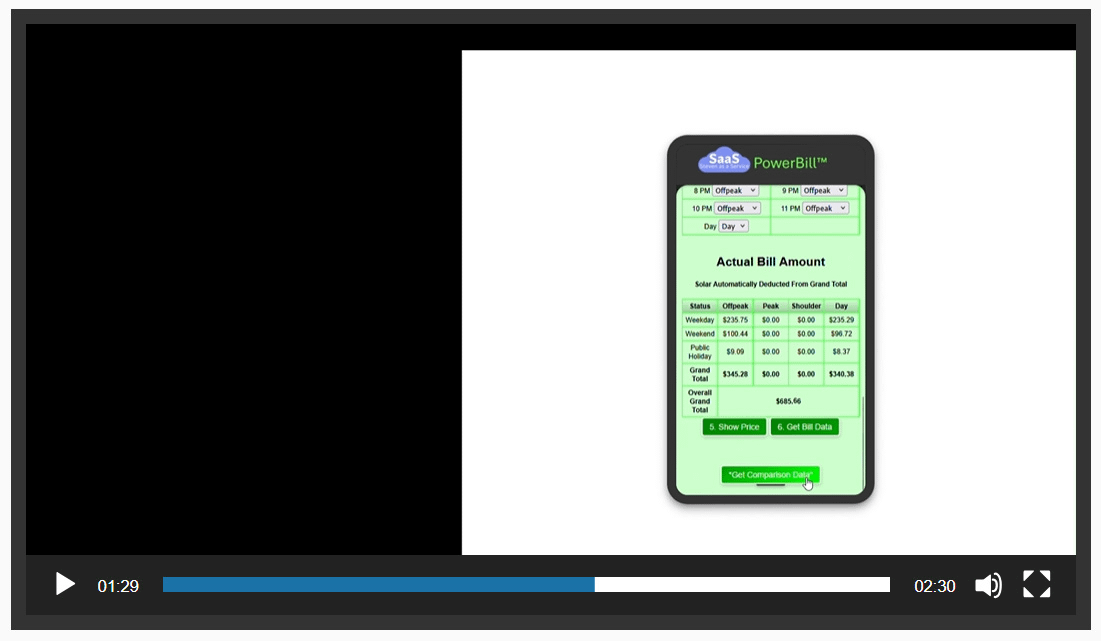
Watch the demo clip at:
https://mysaas.website/power-bill-facts-you-need-to-know/
About Steven
Steven is a qualified Project Manager and Accountant, experienced in leading dynamic technology and compliance projects.
Using his entrepreneurial skills and knowledge of building and implementing technology in large corporate settings, he is also providing everyday consumers with ‘useful’ apps that helps them manage real and everyday household matters.
Through his 2nd business, ‘Steven as a Service’ (SaaS for short) and yes that was all intentional, Steven aims to be a leader in providing low-cost low-maintenance consumer focused apps.
If you would like to contact Steven to discuss: this article, any points raised or new collaborations – send a message through this contact form.
