
by Geoff Helisma (Clarence Valley Independent)
As the new highway nears completion across the Lower Clarence, fears have been raised about what happens during a flood, due to the highway apparently acting as a dam at various locations.
The areas around Ferry Park to Shark Creek (where rising floodwater first breaks the river’s banks) and Chatsworth Island (where long sections of the highway “act like a dam wall”) are locations where floodwater behaviour will be affected.
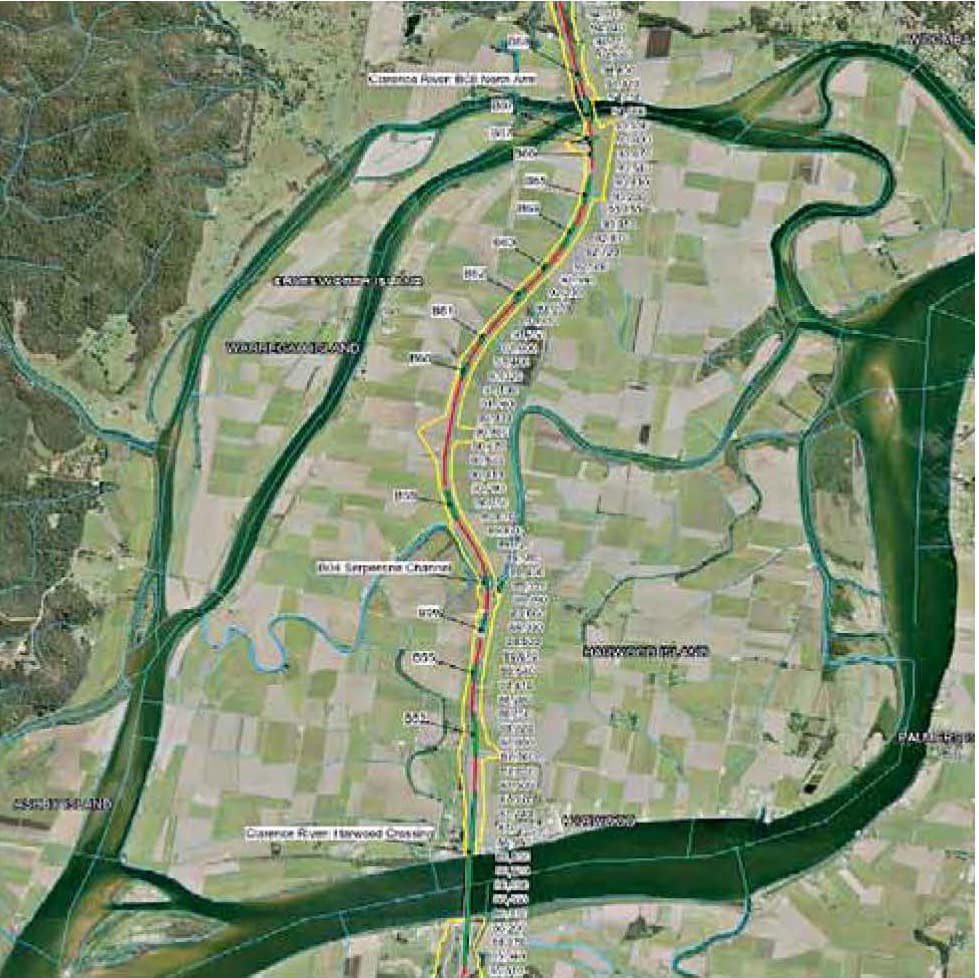
Chatsworth and Harwood islands: For large flood events that exceed a 20-year ARI (average recurrence interval), flow breaks out of the main channel of the Clarence River, with the dominant flow direction from west to east across the floodplain of Harwood and Chatsworth Islands.
Image: from Hydrological Mitigation Report, Glenugie to Devils Pulpit
And, with the Bureau of Meteorology announcing that there is a 70 per cent chance of La Nina developing (“roughly three times the average likelihood”), which “typically increases the chance of above average rain- fall across much of Australia during spring”, the flood modelling in Pacific Complete’s Hydrological Mitigation Report, Glenugie to Devils Pulpit could be put to the test sooner, rather than later.
In general terms, according to a letter from Transport NSW, in answer to an enquiry by Chatsworth Island resident Shane Williams, changes to flood behaviour across the Clarence River regional catchment are as follows:
- A minor increase in flood level to the west of the highway;
- A minor decrease in flood level to the east;
- A minor increase in flood duration to the west and also to the east in some areas; and
- No perceptible change in flood velocity or direction.
The mitigation report states in the overall flood impact assessment that resultant increases in flood levels across the floodplain are “considered minor and generally meet the limits set by the flood managements objectives”.
On flood duration, the report states that, overall, any changes in duration “meet the limits set by the flood management objectives (less than five percent increase)”, however, at “some small localised areas … between Maclean and Iluka Road … the flood duration is predicted to be affected by more than five percent”.
“Under existing conditions, most of the land within the Clarence River regional floodplain is flooded for more than 72 hours for the 20, 50 and 100-year ARI (average recurrence interval) events,” the report states.
“For the 5-year ARI event, areas around the fringe of the floodplain are flooded for a range of durations from less than six hours up to 72 hours.”
The report states that “there are small increases in flood level between five millimetres to 15 millimetres in the Clarence River main channel” and that “there are no impacts to the township of Maclean in the 5 and 20-year ARI flood events, as the Maclean levee is not overtopped”.
While the levee “is overtopped under both existing and future conditions for the 50-year ARI event … and a large part of Maclean is flooded”, the report notes that “further anal- ysis” of the 50-year ARI event is incomplete and that “mitigation measures are under investigation”.
At Harwood “a minor increase in flood levels upstream due to the bridge piers” is an expectation.
“The increase in flood level for the 20, 50 and 100-year ARI flood events are generally between 10 millimetres and 15 millimetres, with a localised increase of up to 17 millimetres over 300 metres immediately upstream of the centre of the bridge in the 100-year ARI event,” the report states.
Regarding cane land, the report “identifies four days as the time of submergence that will cause damage to cane” – for example 5 days (120 hours) results in a 15-20 percent loss in yield, 10 days (240 hours) 30-60 per cent and 15 days (360 hours) 37-100 per cent.

“Based on this information, flood duration impacts resulting in total flood durations of up to three days (72 hours) on cane land in future conditions (with the upgrade in place) are assessed as low risk impacts.
Looking at the cane land on Chatsworth Island, however, there may be some extra “localised” yield losses during 5 and 20-year ARI events, where the largest area of change in duration occurs around the Chatsworth Road south and north overpasses”. “In these areas the duration has increased by more than 72 hours,” the report states, and is “most prominent in the 5-year ARI event”, although this “may be overestimated due to the coarseness of the model grid and the lack of representation of drainage features (such as cane drains and swales) smaller than 20 metres wide”.
This article was first published in the Clarence Valley Independent, 26 August 2020.
