
Every time someone brings up the Southern Oscillation Index or the Indian Ocean Dipole, I nod along and drift off. But a recent conversation with an old boarding school mate gave me hope that maybe it’s not as complex as I originally thought and maybe some of the amateur Wheatbelt weather forecasters might have more than half a clue about what’s going on out there.
David Syme, a former farmer from Esperance and now a grain buyer for Milne Feeds, is one of those weather savants. When he’s not on the phone to farmers buying grain, he’s tracking sea surface temperature charts, satellite feeds, and data from the southern Indian Ocean to determine if Milnes or the rain will be feeding the states sheep next month.
Syme reckons the biggest leap in forecasting in the past few decades hasn’t come from BOM’s Doppler radars —it’s come from the slow accumulation of ocean data, particularly sub-surface temperatures, combined with the power of supercomputer modelling.
He first twigged to the link between sea temperature and rainfall back in the 1980s after talking to Esperance fishers who had a vested interest in reading the mood of the ocean. Warm patch 200km offshore? Expect fish to move—and rain to follow.
Problem is Australia didn’t start seriously tracking sub-surface ocean temperatures until 2006 with the launch of IMOS. The game-changer, though, was the early 2000s arrival of Argo floats—autonomous buoys that dive to 2,000 metres every 10 days, measuring ocean temperature and salinity. The first Southern Ocean deployments came in 2001, backed by CSIRO. Today, Australia operates 50–60 active floats across the Indian and Southern Oceans. Combined with moored buoys, volunteer ship observations, and satellites, we finally have a 3D picture of ocean heat—replacing the old surface-only guesswork.
This ocean data became even more powerful when BOM plugged in its first supercomputer, a Cray T3E, around 2000. That system, and its successors like the Cray XC40 “Australis,” now run complex numerical models that simulate the planet’s atmosphere with increasing resolution. The ACCESS model, which powers today’s forecasts, digests terabytes of data to spit out rainfall maps and seasonal outlooks.
Still, as Syme puts it, you can have all the computing grunt in the world, but if the data has big gaps in it, the output’s going to have big error factors built into it, think climate modelling and how the models fail miserably when run backwards and are wildly inaccurate when benchmarked against the actual temperature. And this is where WA’s weather modelling is still falling short—good at temperature, poor at long-term rainfall predictions.
Since the 1950s, each decade has brought a new idea to the climate table. In the ’50s and ’60s, scientists stumbled upon El Niño and La Niña in the Pacific, giving rise to the Southern Oscillation Index. In the ’80s, focus turned south to the Southern Annular Mode (SAM) and the circumpolar westerlies. The ’90s finally gave the Indian Ocean Dipole its due—perhaps the most critical player in WA rainfall. By the 2000s, satellite imagery and early supercomputing models made multi-week forecasts possible. In the 2010s, we learned to track ocean heat below the surface, with floats and gliders mapping warm blobs that would influence weather weeks later.
Yet for all that progress, there are gaping holes in what we still don’t know. We don’t fully understand why a negative IOD suddenly flips mid-season. We haven’t nailed the triggers of rainfall over dry soils. We don’t track temperature contrasts between Exmouth and Albany closely enough—contrasts that often dictate whether the next front will deliver or disappear. We haven’t incorporated how decades of land clearing or the move from pasture to continuous cropping may have altered local convection. And fringe theories—cosmic rays, solar cycles, submarine volcanoes—remain on the academic fringe, rarely considered by operational models.
Add to that the Leeuwin Current, the warm ocean flow that hugs WA’s coastline. Without it, WA’s climate would more closely resemble the Namibian desert—cold, dry, and foggy. The strength of the Leeuwin changes year to year and plays a big role in the formation of cloud bands in autumn. If you want to forecast the break, keep an eye on the hot strip from Broome down past Cape Leeuwin. If that water is warm, the atmosphere has fuel. If not, expect a slow start.
So how do we get better forecasting out of BoM. The good news is the state government funded Murdoch University to lead a major climate research initiative using the Setonix supercomputer—the Climate Science Initiative will produce high-resolution models at 4 km and 20 km scales, a huge leap forward from the 60–200 km grids the Bureau currently churns out.
The first 20 km projections for the whole state are due in 2025, with 4 km projections for the South West in early 2026 and the North West later that year. By the second half of 2026 an online climate viewer will make the data publicly accessible. The only problem is better modelling is only half the story. Western Australia still lacks hard data from the Indian Ocean—the single biggest driver of our weather.
Boosting the network of submersibles and drifting buoys is what’s needed to capture deep-sea temperatures and dramatically lift the accuracy of forecasts that farmers and fishers depend on—not just in WA, but across the entire Indian Ocean. Our State Minister for Fisheries (Hon. Jackie Jarvis MLC), who also happens to wear the agriculture hat, should be asking her Director General—once the head of the old Fisheries Department and well aware of how long-term ocean data underpins fisheries management—to explain why the Indian Ocean is central to her portfolio.
Deep within DPIRD there are some seriously smart fisheries scientists who could give the Minister long technical briefings and—heaven forbid—help her forge genuine scientific collaborations to do something to improve fisheries management.
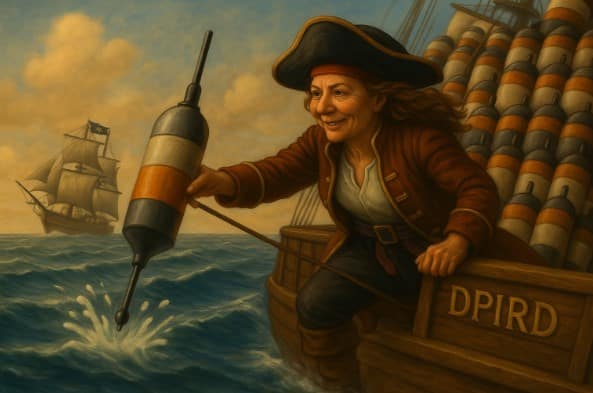
So here’s the challenge: once the drought policy is bedded down, the Minister could follow her mentor, climate-cheerleader McTiernan, and match the 2021 $15 million Climate Change Resilience Fund with a $15 million Indian Ocean Temperature Mapping Program. Modelled on the global Argo float network, it would be a genuine game-changer. Each buoy costs around US$20,000–30,000 to build and deploy—serious money, yes, but small compared to the value of getting forecasts right for both farmers and fishers.
To cover the Indian Ocean, you’d need 200 – 300 floats—an outlay of AU$15 million plus several million a year in servicing. That’s not small change, but it’s in line with other national R&D investments and the dollars MacTiernan wasted on regenerative farming systems.
The partners, or should I say collaborators, for such a project are obvious – CSIRO, BoM, UWA Oceans Institute, Murdoch University (CSI project), Fisheries FRDC, Grains GRDC, DPIRD, plus INCOIS (India), JAMSTEC (Japan), NOAA (US) who already operate drones in the region. Now there’s the next overseas trip for the Minster. She can beat Albo to a meeting with Trump.
Such a coalition would finally anchor WA in Indian Ocean science, connect offshore data with onshore decisions, and let the Minister strut the world stage as another example of a Labor leader who set up yet another major science collaboration (read last weeks Opinion in the Farm Weekly). Now that would have me and the David Symes of this world singing the praises of Minister JJ as a true Captain in research science. The alternative is to spend $15m handing out those $5000 cheques when it does not rain. One is collaborative and visionary, the other cheap politics.
